
Heads up. This is going to be a non-genealogy post, but it may an interesting read to some. Fair warning though, it may get technical and geeky at times. People sometimes ask me how I set up the system in my house to track how often my sump pump is running, so instead of trying to remember everything, I wanted to post about it. This is the best place for me to do that.
A little backstory first. The house I live in, which was first purchased by my paternal grandparents in 1955, seems to have been built on a natural spring (actually, probably swampland like the a lot of this area.) Any time it rains, it seems the water from a large radius from here all flows to my basement. I have two sump pumps installed, the primary and a more powerful backup. I’ve only ever seen both run simultaneously twice, in June 2008 and August 2018, when we had a ton of rain, quickly. I did not sleep well for those few days. To help keep my sanity when I was away from home, I set up a system that tracks when the sump pump fires off. This information is then fed to a personal website of mine that shows the information in a few nice charts (how often it runs per day and how long in between runs.) The whole process is somewhat cheap, there is only one step that costs money (besides the sump pump/appliance)
The basic workflow of this process is this: water pours into my basement → sump pump fires off → information is put in a spreadsheet. Then, when my website is viewed, this happens: Brian visits website → spreadsheet info is pulled into website → data is parsed → data is shown in pretty charts.
Here is a more detailed workflow and some basics on each part.
Capturing the Data
- First you need at least one sump pump. Though, this would technically work on any appliance that plugs into a normal 120V outlet.
- Between my sump pump and the outlet, I have installed a Belkin WeMo Insight Switch Smart Plug. This device allows you to control the appliance plugged into it remotely from a smart phone. It can also interact with a website called IFTTT, which we will get to next. I did do this a few years back, Belkin may have come out with more powerful devices.
- The Belkin device is built to interact directly with a neat, powerful website called IFTTT (If This, Then That). It’s basically a site that does at least one thing when another thing happens, but it interacts with a ton of websites and apps you may already use. You can read a nice overview here. So, I built a “recipe” in IFTTT that when my pump fires off, the Belkin device sends the date and the status (On/Off) to a Google Spreadsheet. Took me two seconds on the site.
Viewing the Data
Now my device is constantly saving little bits of data on when it goes on and off (though, “off” isn’t as important to me.) That part is relatively simple and non-technical thanks to some powerful devices and web services. The viewing part is more geeky.
- I built the website to view this data by myself, mainly to see if I could. So, the first part required a web host (which I already have) that supports at least PHP, which I wrote it in. Technically, you could just run this on a locally installed web server for free, like Apache or use something like WAMP. I’d like to move some of this information to a MySQL database (for better historical archiving) instead of Google Spreadsheets, but I haven’t had the time.
- When I visit the site, the first part of the process goes to the Google Spreadsheet and grabs the current data in JSON format (just an easier format for the code to process.) You need to share your spreadsheet publicly for this to work (or use a more complicated authorization option.) Someone needs the exact URL to see it, so I’m not worried. There seems to be a max size for Google Spreadsheets of 2000 rows, so occasionally a new spreadsheet gets made and I need to re-point my code to the new sheet.
- The data is pulled in and parsed using mainly JavaScript to convert date formats and all that fun stuff and determine time between runs.
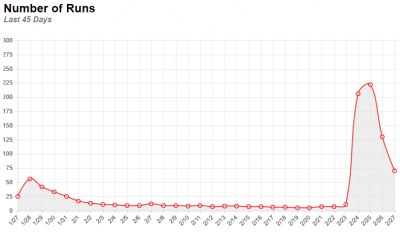
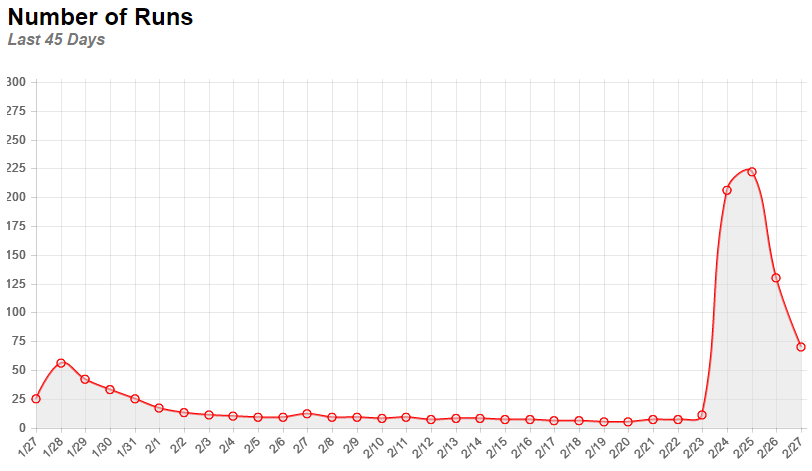
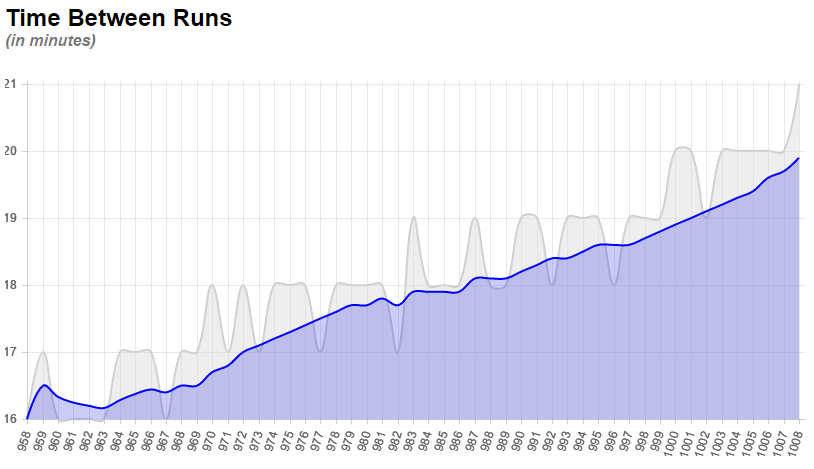
- The newly parsed data is then fed into a free library called chart.js that allows you to create powerful charts in JavaScript. I may try another charting script soon that I found, but chart.js is nice. I create two charts with the data.
- One chart that shows me how many times the pump ran per day.
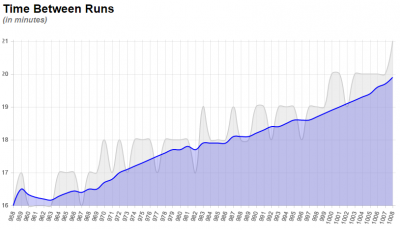
- The other chart shows me how much time passes between runs. The lower the number, the more often it is running, and vice versa. The light gray lines are the actual minutes in between. The blue line is a moving average of the last ten runs, which helps to determine the trend, better or worse.
- One chart that shows me how many times the pump ran per day.
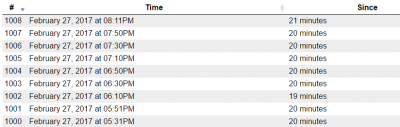
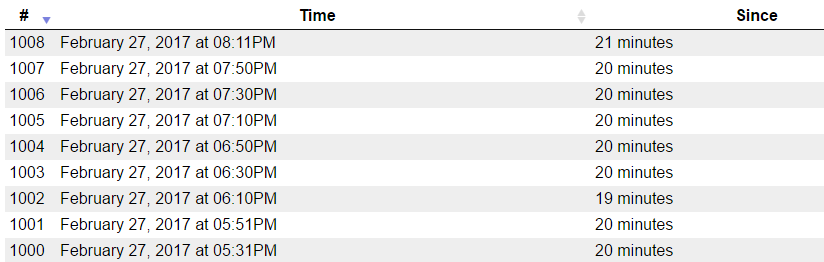
- The other part of the page is a table showing the data for each time the pump ran. This just allows me to look through them all for anything out of the ordinary. For that, I just use an HTML table, but then I use a free script called DataTables that allows me to add some nifty features to it like sorting and pagination.
That’s about it. For only about $50, I’m able to have some peace of mind. There is a lot you can do with free applications and scripts out there. Next step regarding my sump pump is to get it attached the the city’s storm sewer so I don’t have to pump it down my driveway anymore. That will be more than $50. Next steps for the site are to hopefully get that information into a database so I can better look at the old data (which month does it run most, etc.)
Here are the items I used again in a nifty list:
- Belkin WeMo Insight Switch Smart Plug from Amazon
- IFTTT (If This, Then That) – free service website
- Google Spreadsheets – free service from Google
- A web host (though, you could technically run this on a home computer using a free web server, like Apache.)
- jQuery – a powerful JavaScript library
- chart.js – Open Source JavaScript charting library
- DataTables – jQuery-powered HTML table enhancement library